

The 2026 Rate Report
The going rate is...

Finally, it’s here! Our now-annual survey of independent consultants and what they charge. First, a big thank you to everyone who contributed to this report. When I began consulting, I couldn’t find great information to help with the “running the business” side of things. I wanted to create a free resource to support others in the same boat, which is why I started this Substack. The amazing response shows you feel the same way and are similarly motivated to fix it. It’s pretty cool to look around and see myself in the midst of such a great community.
I’m grateful to you for being part of this. It helps all of us deliver better work to our amazing clients and build sustainable businesses for ourselves. Last year’s rate report was based on fewer than 20 responses and a handful of questions. It still became the most-read thing we’ve ever published, but the feedback was to do it again with more people and more questions.
This year, more than 50 independent consultants in the social impact space answered a survey roughly three times as long covering rates, retainers, scope boundaries, expense handling, and travel. What follows is a picture of how this community actually prices its work.
If you haven’t taken the survey yet, it’s still open! Every response makes the data more useful, especially in the places where we’re working with small numbers. It takes five to ten minutes, and I’ll update this report periodically as we get new submissions.
Who answered
Forty-four of the 56 respondents (79%) have ten or more years of experience in their field. Thirty-five are solo practitioners, ten are solo-but-regularly-subcontracting, and eleven have employees or a small firm. The biggest discipline clusters are Strategy/Organizational Planning (14) and HR/Talent (12), but we also had a number of respondents in Finance/Operations, Communications/Marketing, Digital, Coaching, Fundraising, and Program Design/Evaluation.
But almost nobody in the survey sample is early-career, and several disciplines are represented by just two or three people. Every number below should be read through that lens: this is a senior, solo-heavy, social-impact community.
Shut up and tell me the number!
We all have different pay structures we rely on: hourly, retainer, project-based, and monthly. The survey respondents were asked to convert their predominant pay structure into an hourly rate so we could compare apples to apples across our sample. For example, if you work on retainer, you were asked to estimate your hours over whatever time period your retainer covers to provide an hourly equivalent rate.
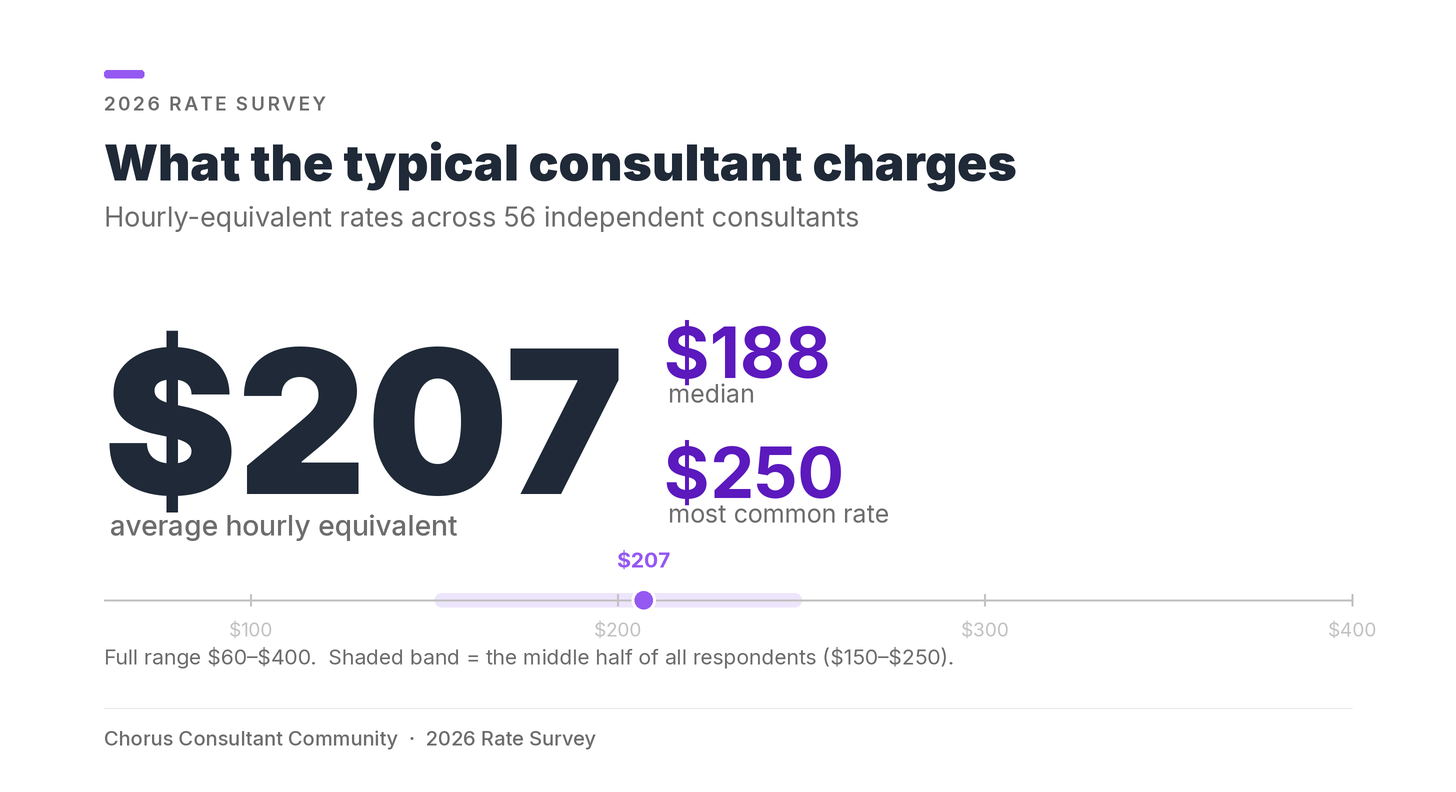
The average hourly equivalent across 50+ respondents is $207. The median, which would be less distorted by a handful of high earners, is $188. The most commonly reported rate (the mode) is $250. The full range runs from $60 to $400 equivalent hourly rate, with the middle half falling between $150 and $250.
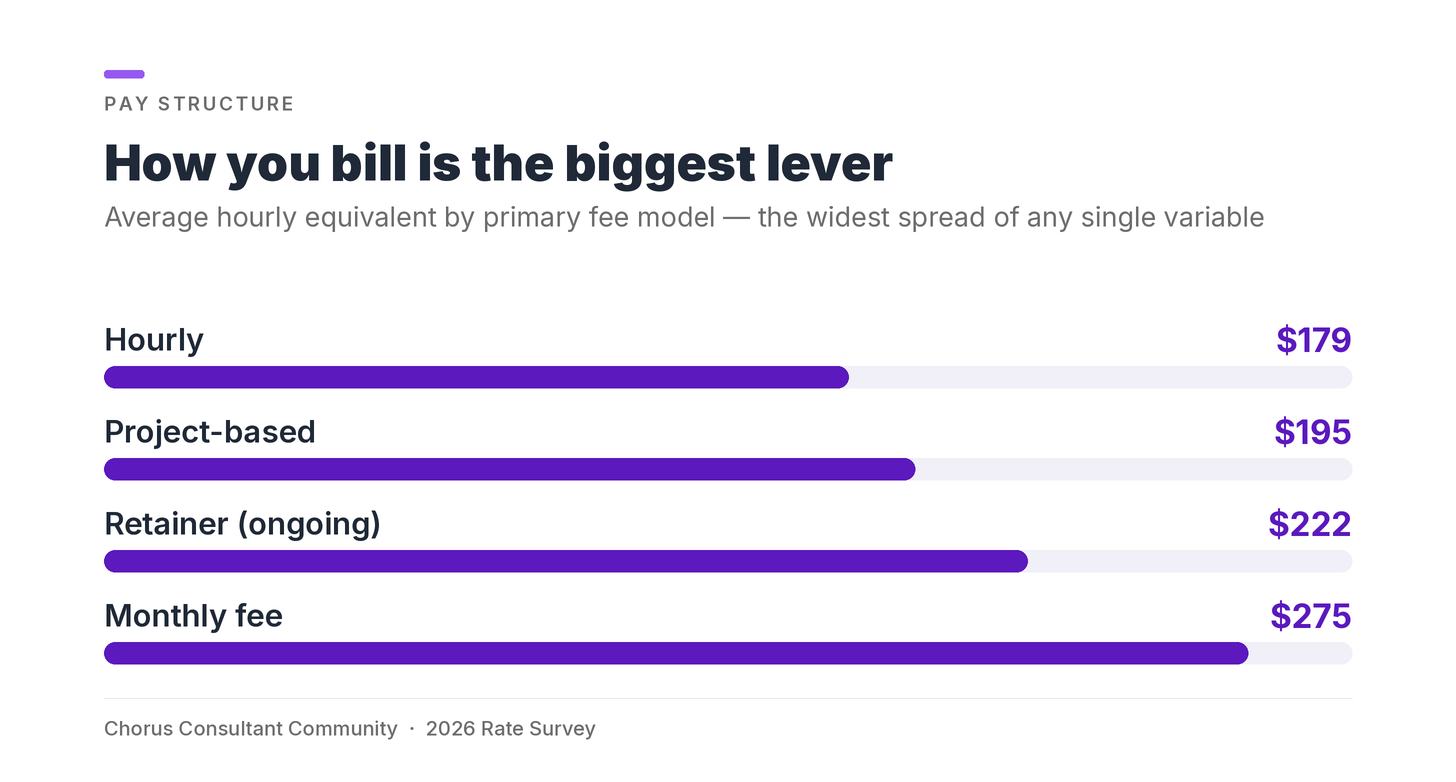
Pay structures matter most
The gap between consultants who primarily use an hourly pay structure ($179) versus retainers ($222) versus time-limited monthly fee ($275) is the widest spread of any single variable in this dataset.
My partner Amy told me to stop billing hourly in my first year. She was right. (She is usually right about these things, and I am usually slow to listen.) I wrote about this in my “Day One” piece, and now we have more than 50 data points confirming it!
This finding is also consistent with what we found in last summer’s sources report. Consultants earning over $150,000 per year overwhelmingly structure their work as retainers or monthly fees rather than hourly or project-based. That report was about how people find clients, and it points in the same direction as this report on fee structure.
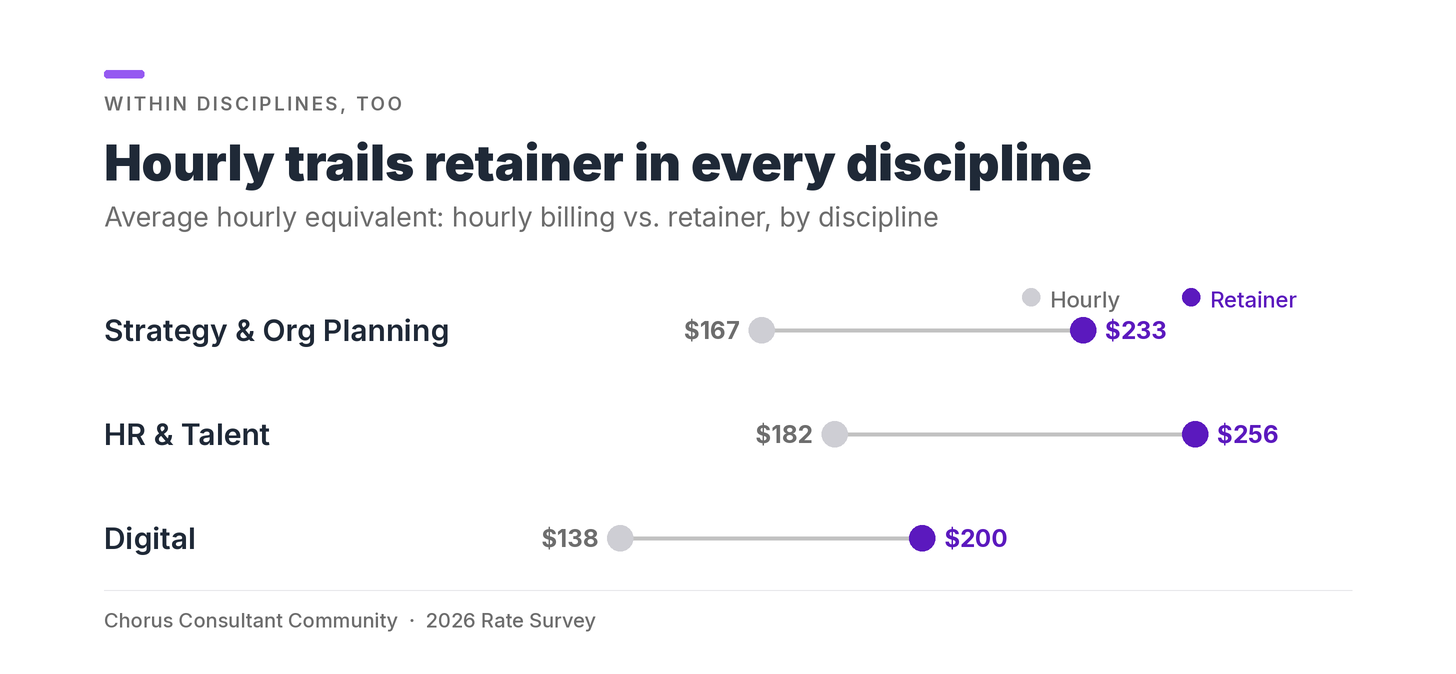
That gap occurs within the various consulting disciplines, too.
Last overall observation is that pricing different work differently tracks with earning more. Consultants who use a secondary fee model on some engagements average $210 in equivalent hourly pay compared to $201 for those who bill one way for everything. A small difference but worth noting.
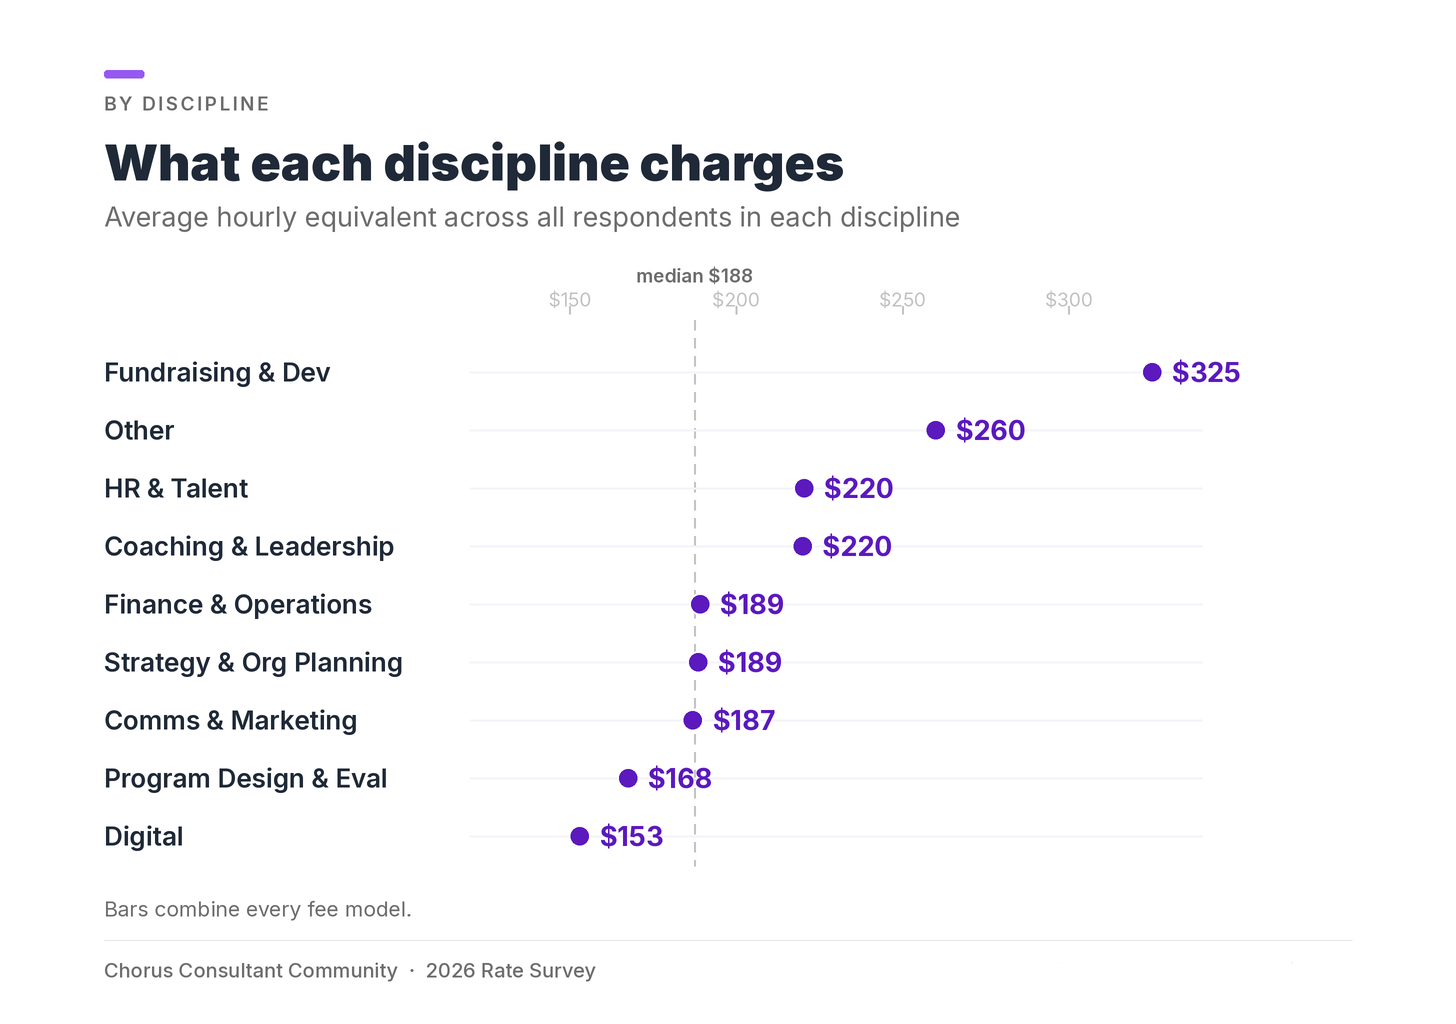
Disciplines
Disciplines showed different average hourly equivalents, but we can’t tell why with the data in hand. It could just be a sampling issue, by which I mean very accomplished people in Coaching could have taken the survey versus schlubs like me in Strategy/Organizational Planning. The best way to spot a lesson here will be to continue doing the survey in the future to see if differences between disciplines hold up over time and how they change.
Experience In-Field
The more experience you have in your field (not necessarily as a consultant), the higher your average pay rate. Folks with under ten years of experience in their chosen field average $175 in equivalent hourly pay as compared to folks with more than ten years of experience who average $216. This finding wasn’t surprising to me, but it’s still useful to know.
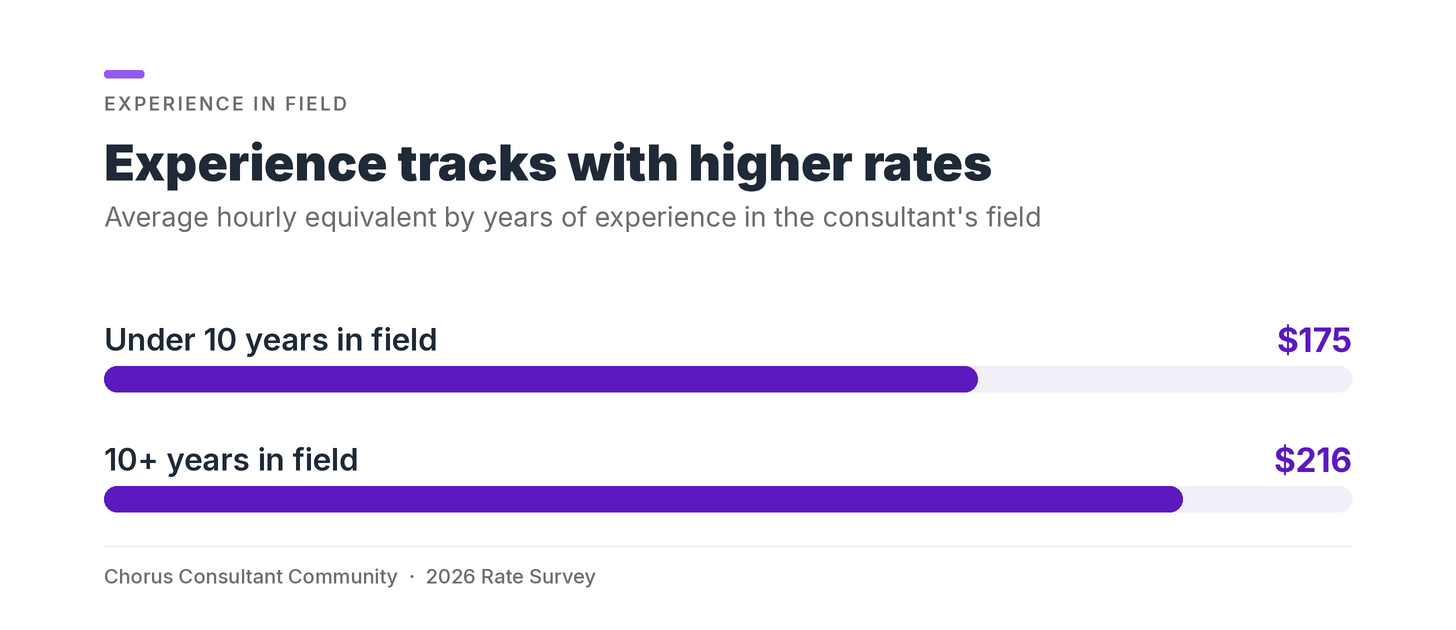
What we don’t know is whether clients are actually paying more for the experience, itself. It could be correlative rather than causal. By which I mean another explanation for this finding could simply be that those with more experience have deeper networks and better connections, and thus can land more plum engagements that pay more. We would need to survey our clients to understand if they do pay a premium for experience. (Hey, that’s a great idea!)
Retainers, retainers, retainers
Seventy-nine percent of the sample earns at least some revenue from retainers. Below 50% retainer revenue, hourly equivalents cluster between $175 and $190 with no real trend. If you’re getting more than 50% of your revenue from retainers, the average hourly equivalents jump to the $230s.
Just guessing, but I think many of us are angling for retainers, and if we’re below 50% then it probably means we’re accepting some sub-optimal work because that’s what we could get.
The only rate-setting input that tracks with higher rates
The survey gave five standard inputs people use when setting rates and let respondents check all that applied. The idea was to gain more insight into how rates get set by understanding what variables influence consultants’ pricing.
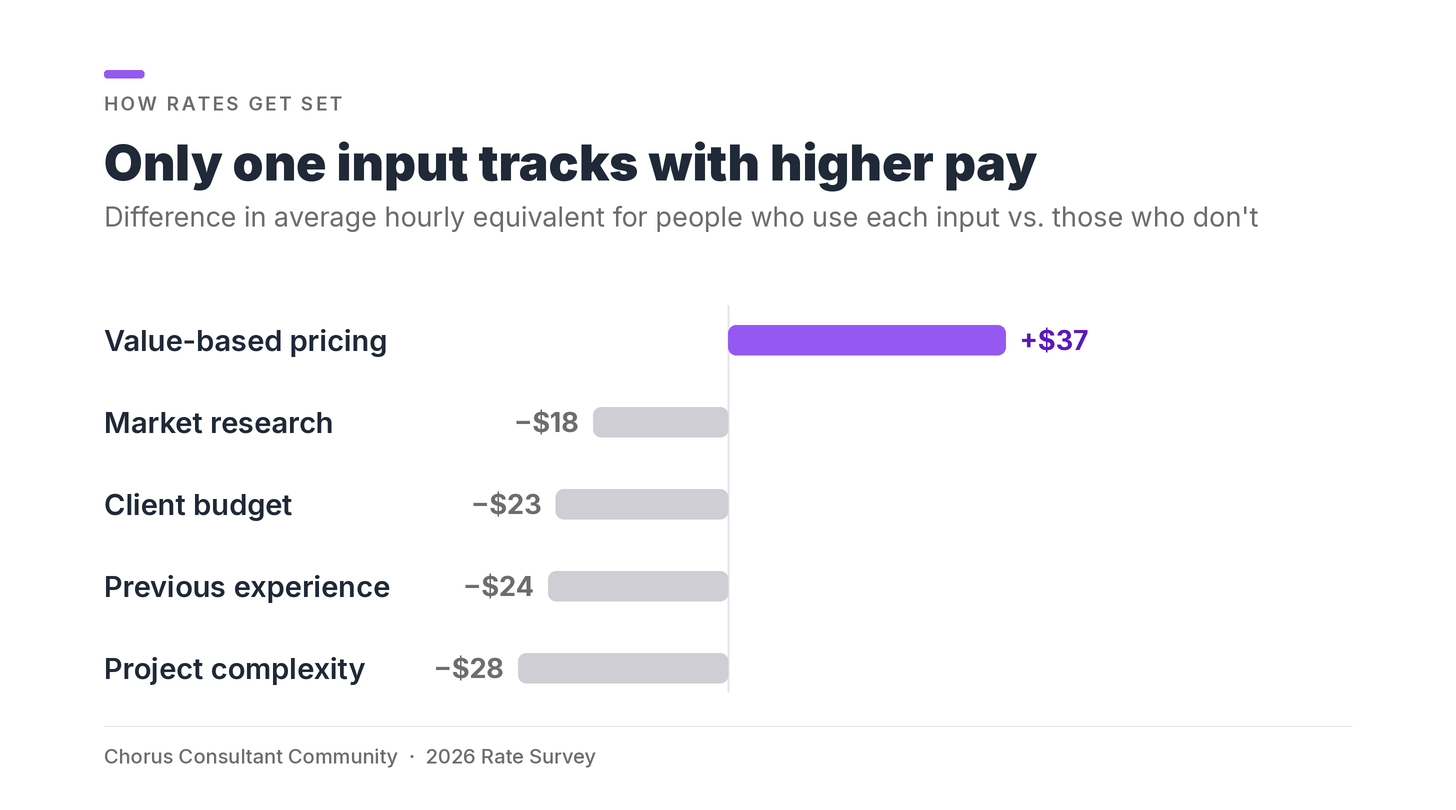
Value-based pricing is the only input associated with higher rates: +$37 over peers who don’t use it. We’ve covered value-based pricing before, but in short, it is when you set a price based on the value being delivered rather than other factors like how long the work will take or how complicated it is. (Also, a great guide on how to use different pricing models here on our Working with Consultants site.)
Every other input is actually negatively associated with the hourly wage equivalent, meaning survey respondents who used any other method of setting their rates had a lower average hourly equivalent.
The usual caveat: this is all correlation, not causation. People who already charge more may gravitate to value-based pricing because it helps them name a higher price, or it may just reflect the high experience levels and business sophistication of the survey sample. But the direction is unanimous across every cut in this data, so it’s worth boning up on how to do value-based pricing in your practice.
Variables for Higher & Lower Rates
Here are a few patterns to compare your methods and pricing against.
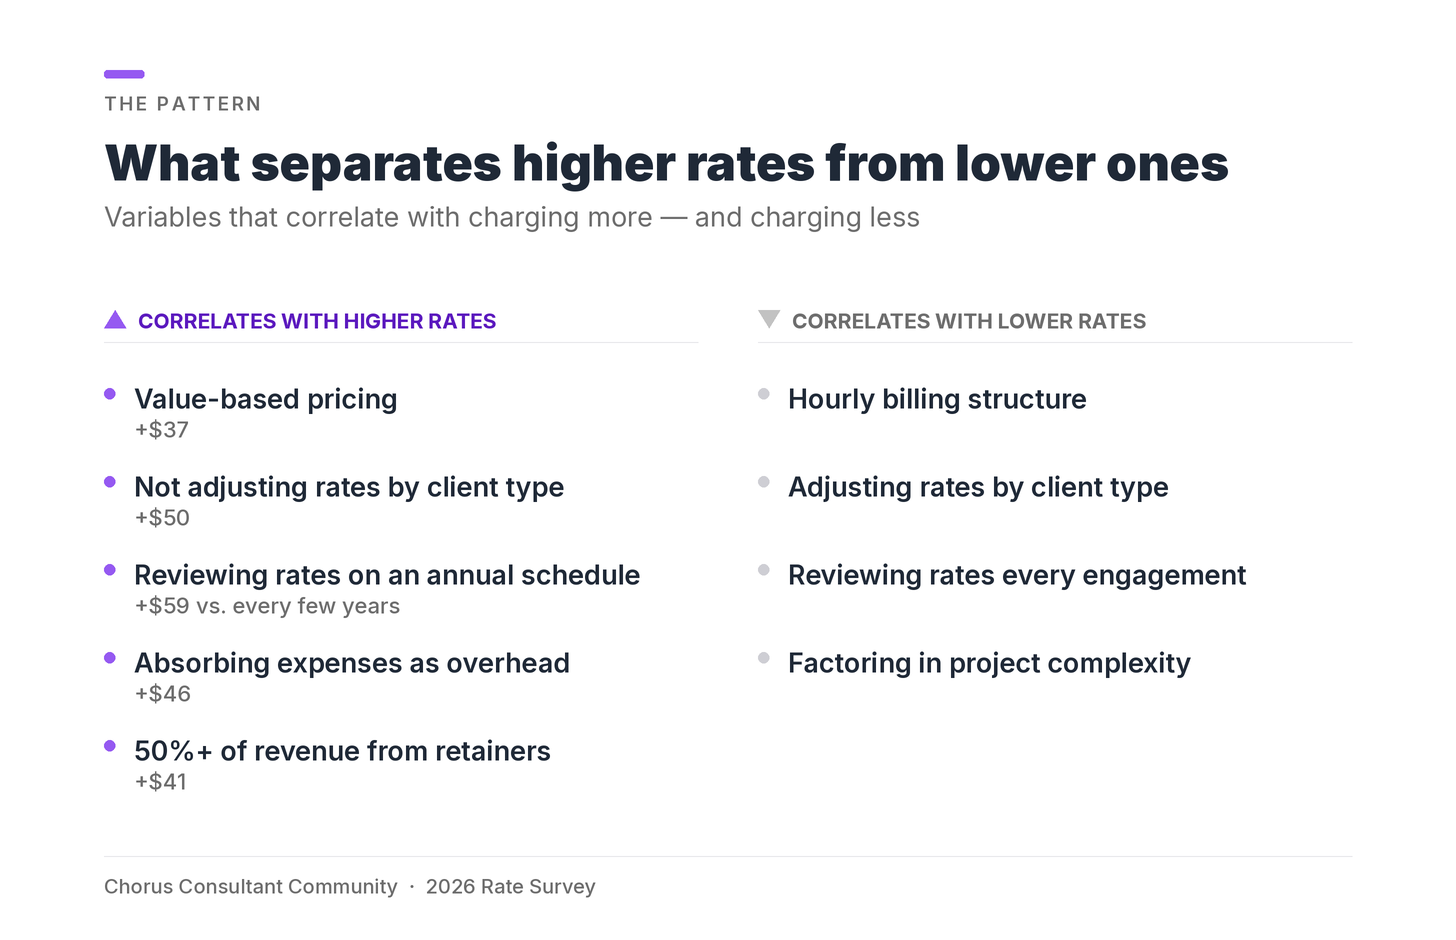
The through line, if there is one, is the consultants earning more have decided their rate somewhere other than in the conversation with the client. They review their rates on their own schedule, they don’t flex their pricing by client type, and they price to the value over anything else.
If I had to hazard an intepretation, it might be that we’re all too flexible. Time and again, I find myself subtly moving in response to a client’s needs. I care about what they’re doing, and I really feel like I can help, so without even consciously doing it, I’m giving them an empathetic discount. It’s where I blur the lines between activist and businessperson. Parsing all of this data gets me thinking that I should price my services based on what their worth and what value they provide, and then cleave to that and just communicate it to prospective clients. And stop pre-negotiating for them!
Confidence doesn’t track with rates
Mean confidence in current pricing strategy: 3.4 out of 5. Twenty-five of 56, just under half of everyone who took the survey, picked the exact middle. People charging $250+ rated themselves a 1 (not confident); people charging less than $125 rated themselves a 5 (very confident). It’s fascinating to me that the highest earners in our sample are the least confident in their pricing strategy.
Freebies
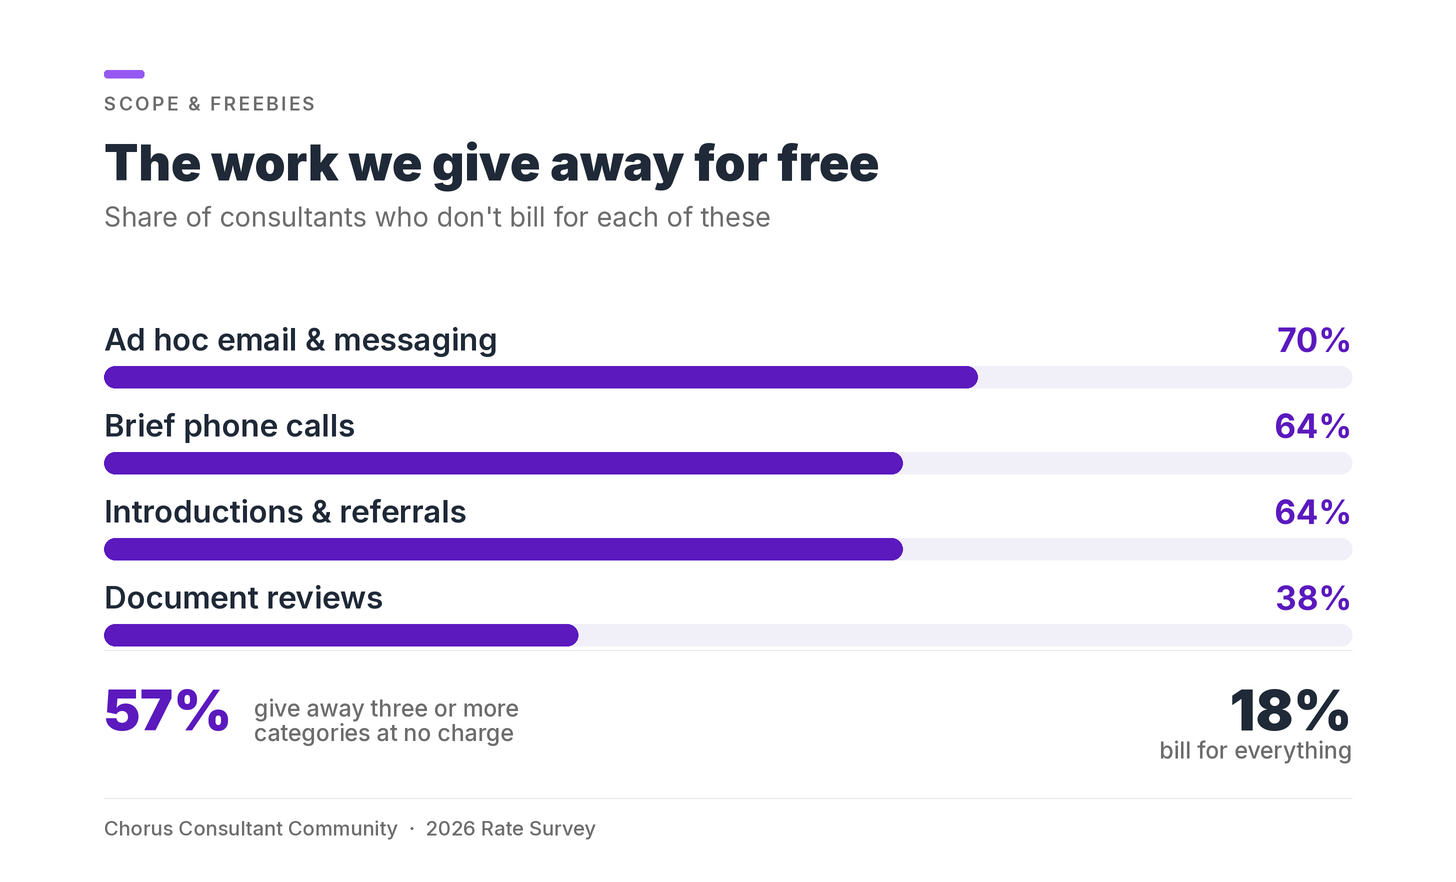
Fifty-seven percent of respondents give away three or more categories of work at no additional charge. On the other hand, only 18% of survey participants bill for everything.
When scope creep happens, 80% of survey respondents absorb the small asks and flag the big ones. Thirteen percent build a buffer into the original contract. Four percent use a formal change order.
The consultants who routinely pass various expenses through to the client average $171 per hourly equivalent. These are things like Canva or CRM subscriptions, job-posting fees, and compensation databases. Reading the responses, the line people draw is whether the tool is for one client’s project or part of their core kit: a database bought for a single engagement gets passed through, often at cost, while anything they’ll reuse next month gets folded into the rate.
The consultants who eat these sorts of expenses as overhead average $217. Absorbing the cost correlates with earning more. I don’t know why that would be, but a guess is probably because higher-priced engagements make individual expense lines feel petty to itemize. A lot of the free stuff could be seen as a relationship investment, and some of it is just the cost of being easy to work with. Still, it’s probably good to be a little more disciplined and intentional about whether you’re choosing to give it away.
Retainer scoping and boundary communication were among the most frequently requested topics in the open-ended responses. Among the 44 respondents who do retainers, what’s included in the fee is fuzzy. 68% of respondents who use retainers include general availability or on-call access, 64% include a set number of hours, 59% say the combination varies by client, and 52% include defined deliverables.
Travel: no norms yet
Sixty-four percent of survey-takers travel to client sites at least sometimes. Among those who do, there is no majority approach to cost handling. A decent chunk of folks pass those costs through to clients directly, another chunk builds it into their fee structure, and many people chose “varies by engagement,” with none of these options clearing half of respondents.
Site-visit scoping splits four ways: built into the project fee (12), case by case (12), separate line item (7), not in proposals at all (5).
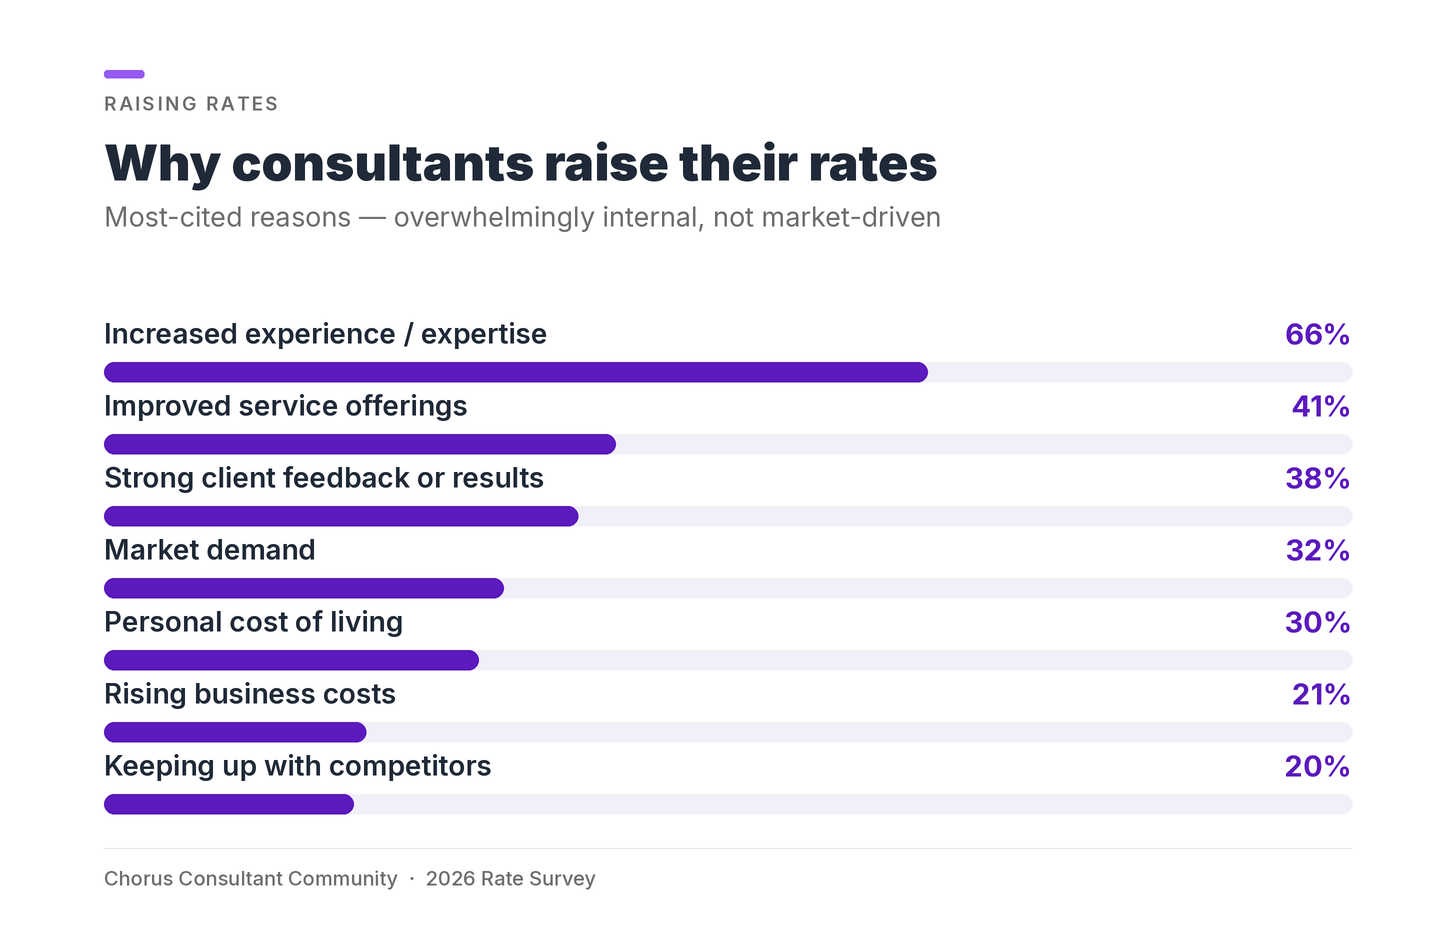
Why people raise their rates
When consultants raise rates, the reasons are overwhelmingly internal. That lines up with what I would have hypothesized prior to the survey, because we lack the ecosystem and knowledge base to use external factors. There simply aren’t any accessible ways to use research data when setting prices!
What you still want to know
Most people answered the last question: what’s the one pricing question you most wish you had better data on?
The biggest cluster: market rates by segment (by discipline, by experience, by region, by client type). One person put it this way: they don’t have a great sense of what the going rate is for someone with their experience, or what a great year versus a mediocre one looks like.
Second: how peers actually set and raise their rates.
Third: retainer scoping. How do you structure retainer agreements when neither hard deliverables nor fixed hours cover what you’re actually offering?
Fourth: value-based pricing in practice.
These questions will get worked into next year’s survey. If you have one of your own, reply to this email and tell me please!
If you haven’t taken the survey yet, it’s still open! Every response makes the data more useful, especially in the places where we’re working with small numbers. It takes five to ten minutes, and I’ll update this report periodically as we get new submissions.
Coming Next
I am working on an interactive version of this data where you can plug in your discipline, experience level, business structure, and fee model and see exactly where you land against the rest of the sample. It’ll be in the next newsletter.
If this was useful, the most helpful thing you can do is forward it to the consultant who keeps asking what they should charge.
Method
56 responses collected May-June 2026 via the Chorus Consultant Community and related networks. Hourly-equivalent figures are self-reported; respondents whose primary fee model isn’t hourly estimated what their work comes out to per hour. Averages are arithmetic means. Multi-select questions (rate-setting inputs, increase drivers, retainer scope, included-at-no-charge) were scored per option. The sample is self-selected and not a representative market survey; small-cell warnings apply wherever counts fall below five. This is the second year of the survey. The sample tripled and the questionnaire expanded substantially, so year-over-year rate comparisons aren’t reliable.