


Since the 2026 Independent Consultant Rate Report went out, 16 more consultants have taken the survey. That brings us to 72 respondents, which is nearly a third more data than the report was built on. Thank you. I said I’d update the figures as new submissions came in, so here goes.
The Headline Number
The average hourly equivalent across the beefier sample is $207. Do you remember what it was when we first issued the report?
If you guessed it was $206 or $208, you’d be wrong. It was $207.
Sixteen new people joined and the average didn’t move a dollar. The median ticked up from $188 to $189. The most common rate is still $250. The full range of hourly equivalents still runs $60 to $400, and the middle half of respondents still lands between $150 and $250.
I guess our survey data was right!
Some Things Never Change (Frozen 2 reference)
The fee-model ladder stayed constant even with more folks taking the survey. An hourly pay model is still the lowest-earning structure with an average hourly equivalent of $173 (down by $6), then project-based at $196 (up by $1), then ongoing retainers at $227 (up by $5), then time-limited
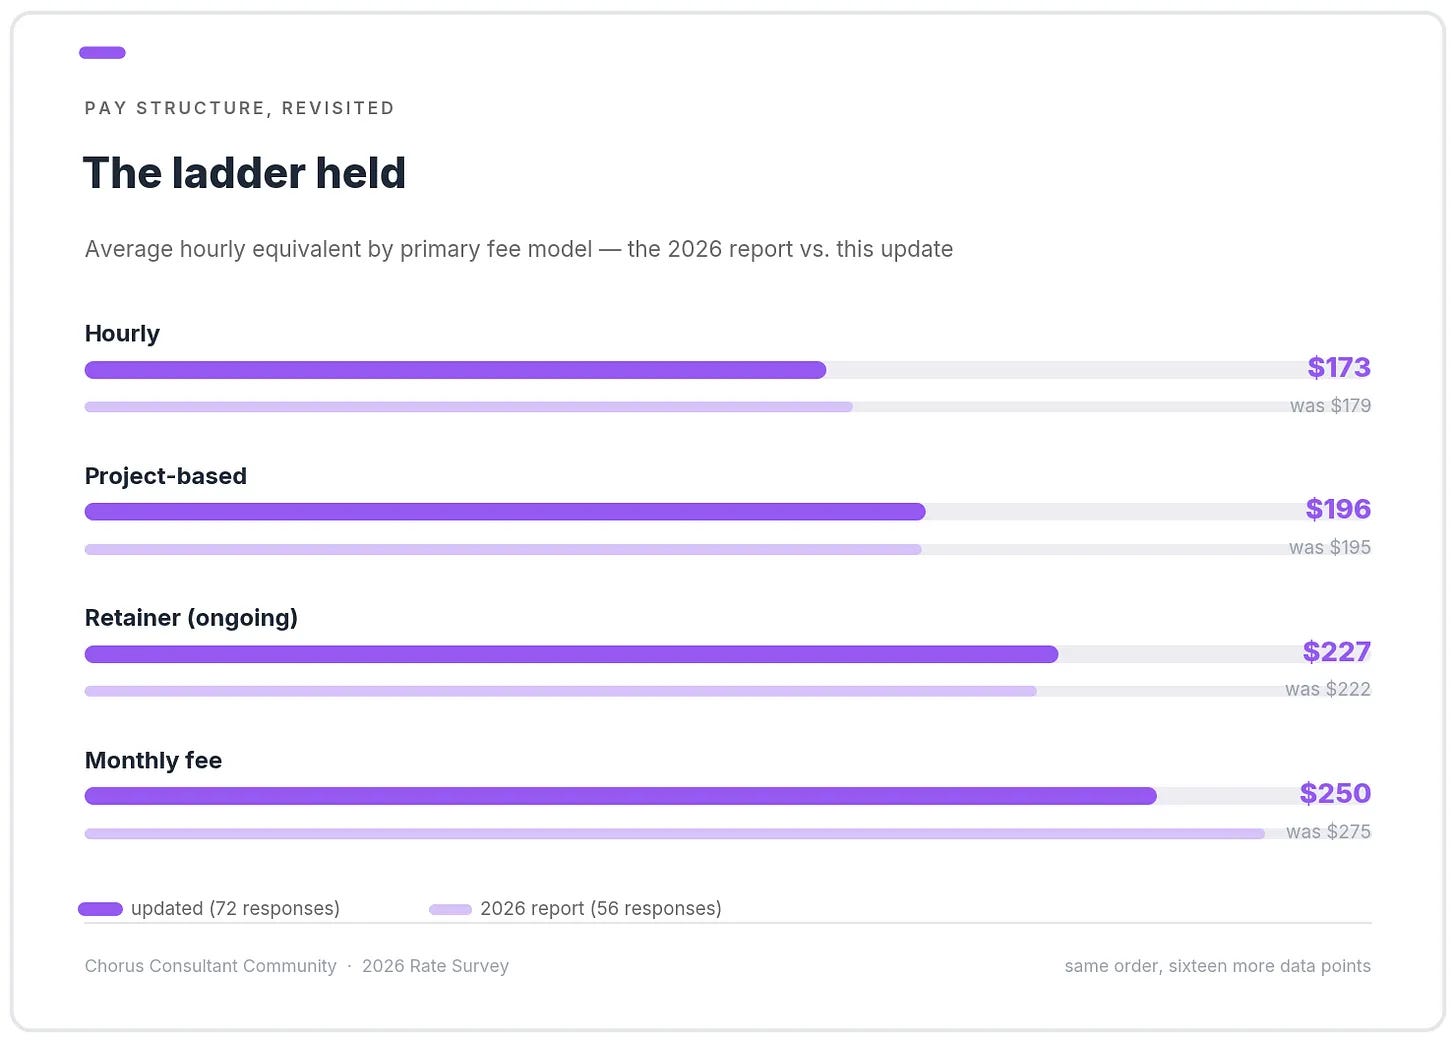
monthly fees at $250 (down by $25).
Consultants who absorb tools and subscriptions as overhead still out-earn those who pass them through, $218 (up by $1) to $166 (down by $5). Ten-plus years in your field still averages $216 (unchanged). Confidence in pricing strategy is still 3.4 out of 5. That’s exactly the same with a third more people. Huh.
The reasons we raise rates are still overwhelmingly internal, with increased experience and expertise leading at 64%.
[Why a Frozen 2 reference? Because my 3.5 year old sings it all the time and insists we play it in the car. So now I hear it in my head, even while writing this newsletter. And misery loves company. Sorry.]
What Did Change
Value-based pricing is still the only rate-setting input associated with higher pay, but the premium it provides narrowed. Consultants who use this technique for price setting are now +$29 versus +$37 in the original report for those who didn’t use it. Every other input still is negatively correlated with your average hourly equivalent. I’d expect some of the original gap to be from the smaller sample, but the direction stayed the same even with 16 new responses, so I’m feeling more confident in the finding.
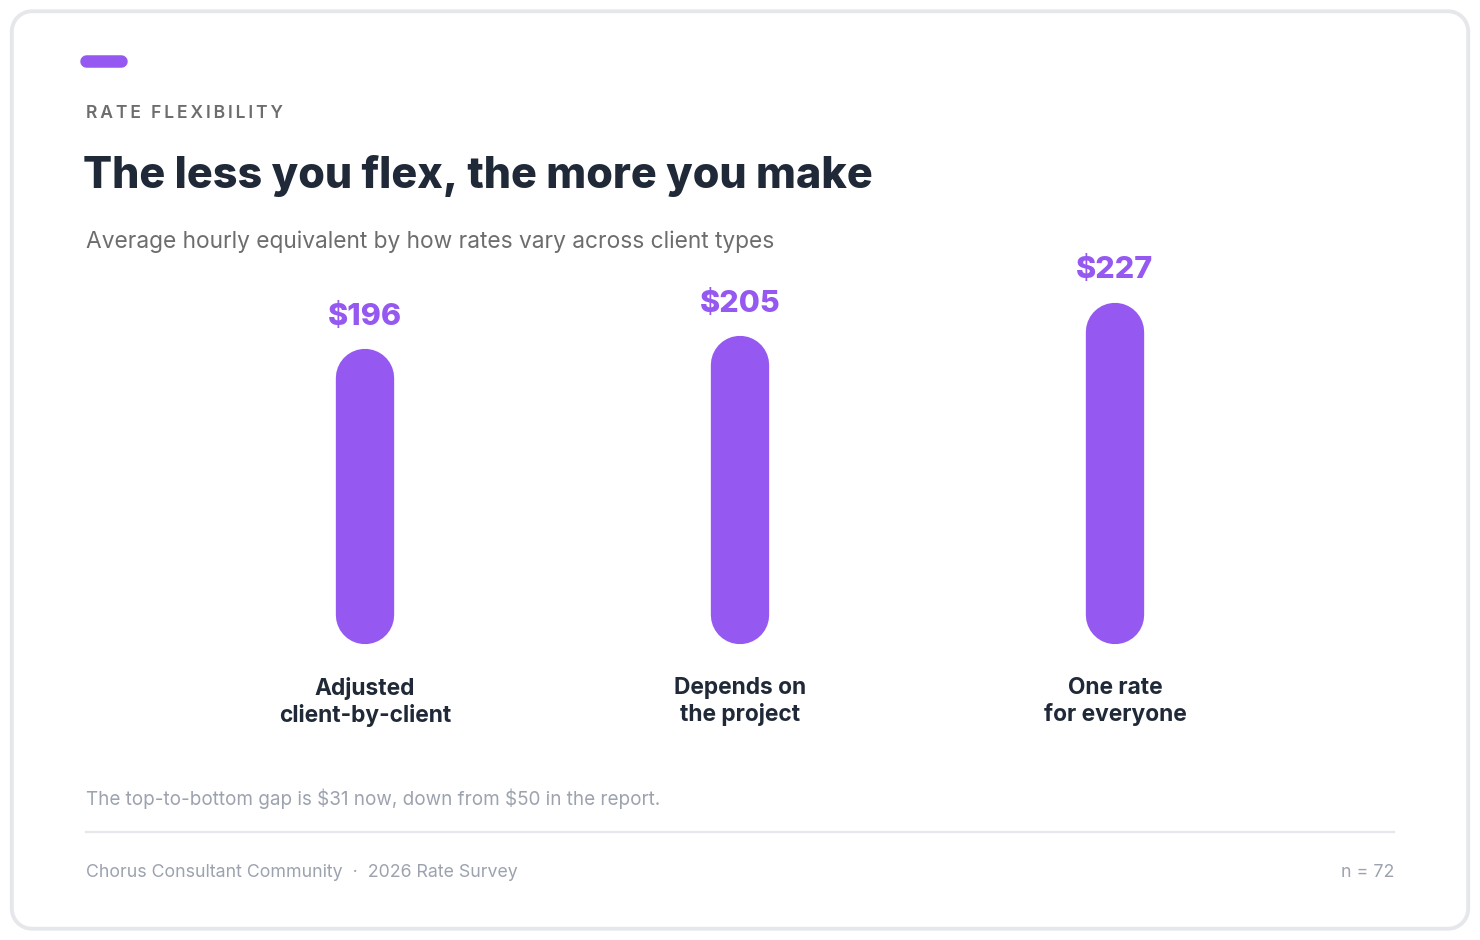
One finding you might recall from the earlier report is that consultants who don’t adjust rates by client type average higher hourly equivalent rates than those who do. The figure is $227, whereas those who adjust rates “depending on the project” average $20, and the client-by-client adjusters average $196. The top-to-bottom gap is $31 now instead of $50. Annual rate-reviewers still lead that table at $235, but their edge over the every-few-years crowd down from $59 to $42. Directionally, I’d still make the argument from the first edition of the report, which is that consultants who are less flexible on rates seem to have a higher hourly equivalent.
Two new things showed up. Among the 46 respondents who travel to client sites, passing costs through at cost is now the choice of a slim majority at 52%. We didn’t have enough data last time to identify what the majority position was (the various groups were all below fifty percent).
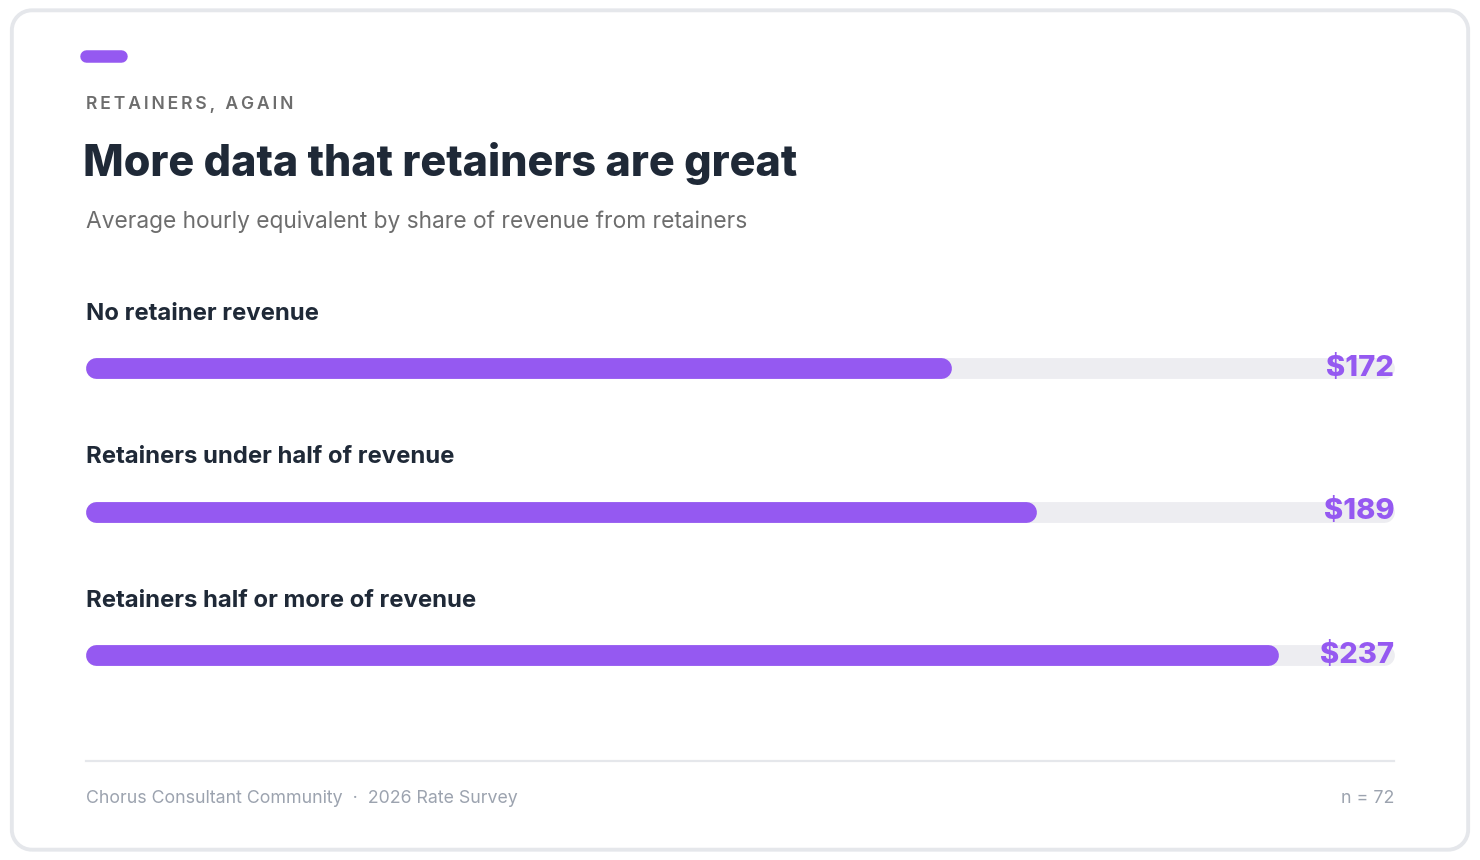
And <sigh>, more data that retainers are great. Boring, I know, but true.If you get more than 50% of your revenue from retainers, the average hourly equivalent is $237 vs. $189, but the folks with no retainer revenue at all now sit at the very bottom, averaging $172.
By discipline (a little more)
The most requested breakdown, by far, is by discipline. At 56 responses I mostly couldn’t do show much, but we can start to with more survey respondents
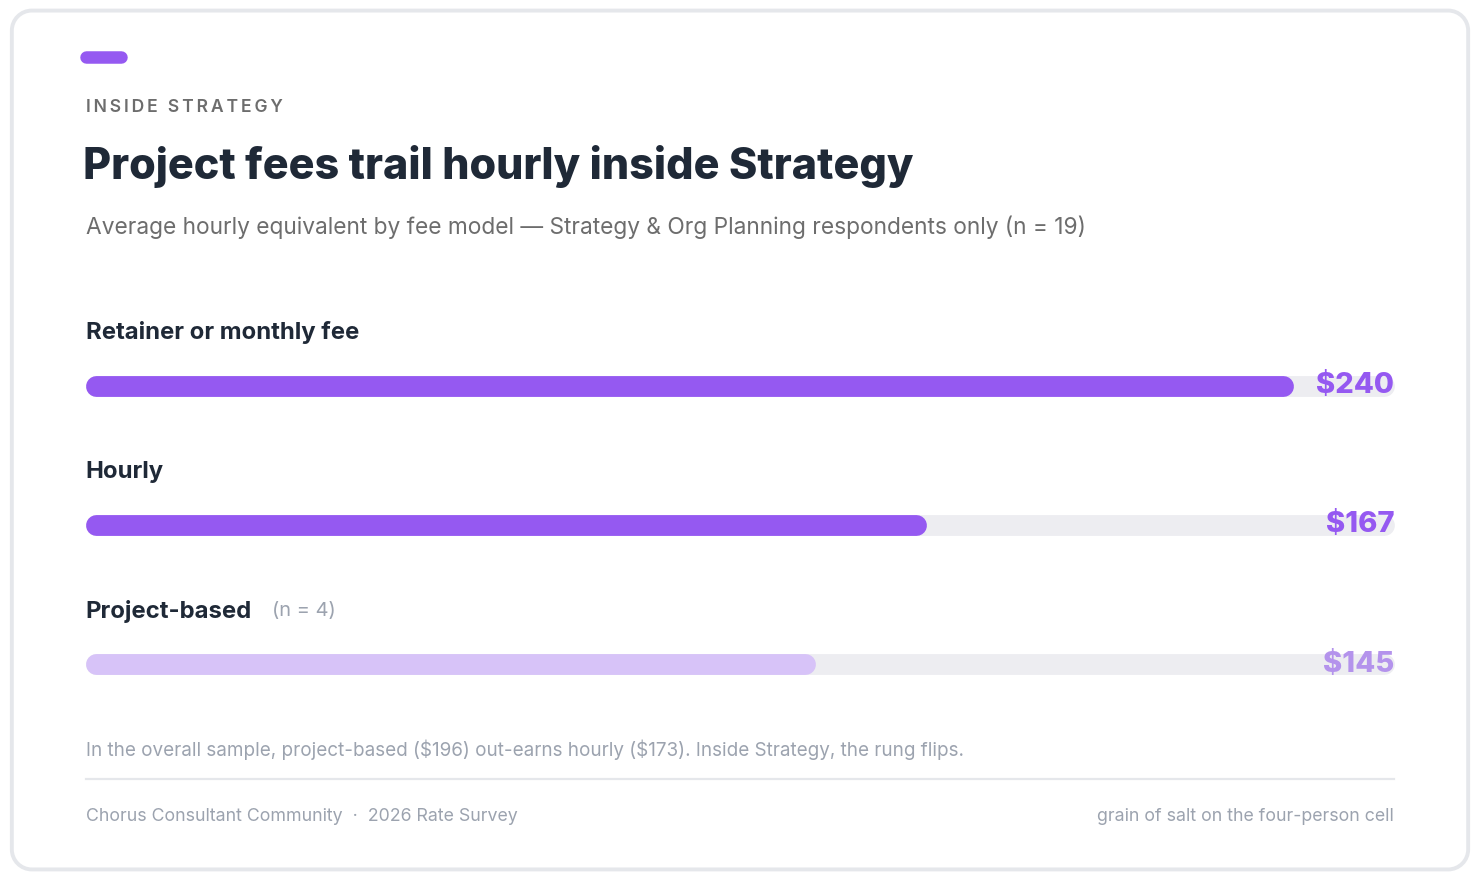
Strategy/Organizational Planning is now the biggest group at nineteen respondents. The average is $199, the median is $181, and the range runs $100 to $325. A few high earners are pulling the average up, because the typical strategy consultant sits closer to $180. The fee-model ladder shows up inside the discipline too, with a twist: strategy consultants on retainers or monthly fees average $240, hourly billers average $167, and project-based billers average $145. Project fees paying worse than hourly is an inversion of the overall ladder. It’s only four people, so take it with a grain of salt. I wonder if this is the empathetic discount coming home to roost. You see the nonprofit’s budget, you know what a strategic plan “should” cost them, and you take a haircut before showing them anything. The value-based finding is also here: the eight who price to value average $239; the ten who don’t average $166.
HR/Talent, at seventeen respondents, tells a similar story with different numbers: average $212, median $182, range $95 to $375. HR folks on retainers or monthly fees average $228 versus $176 for hourly.
A few of you have asked whether the discipline differences are really just experience differences in disguise. Among consultants with ten-plus years in their field, Strategy averages $214 and HR averages $215. Coaching leads at $251 (but only four people); Finance/Operations sits at $192 and Communications at $187. Some of the gap in the big discipline chart is composition for sure, but maybe some of it is a real finding.
Every other group has too few respondents to pull out averages like this.
Keep it coming
The survey is still open, and this update is the argument for taking it: the data visibly improves as more of you participate, and your discipline can the Strategy treatment when enough of you are in it! The thinnest cells right now are Program Design/Evaluation and Fundraising, at three respondents each, and Digital at five. If that’s your world, or you know someone in it, five to ten minutes would help.
If you know a consultant who’s still guessing at their rate, forward this along.